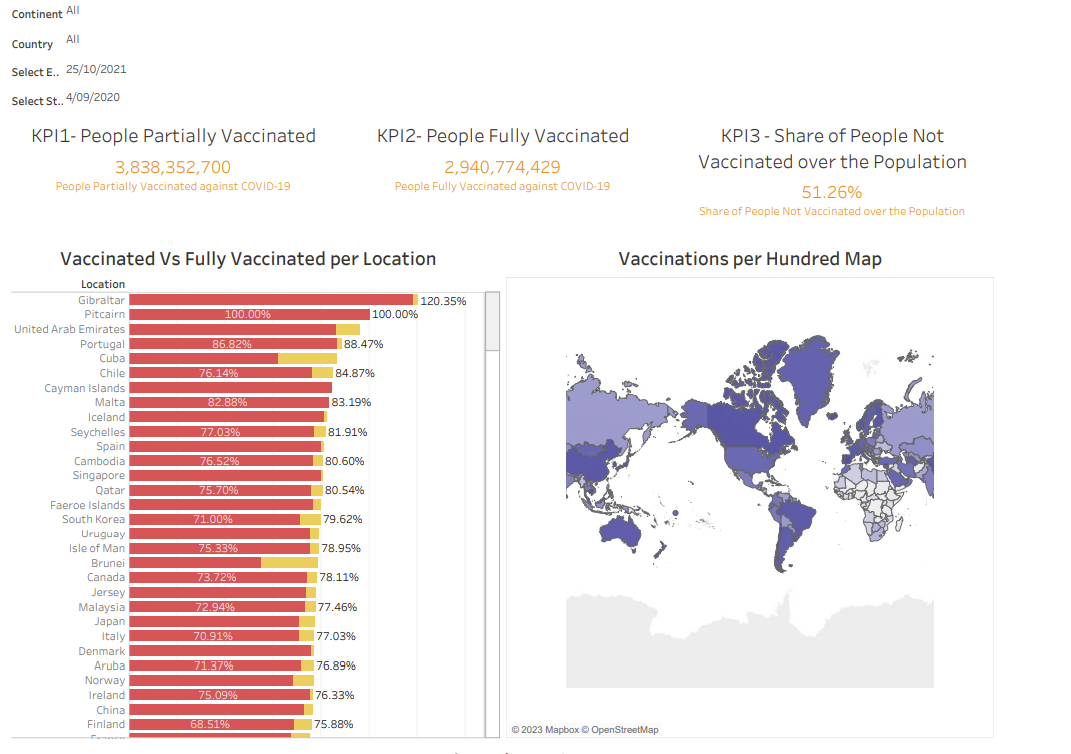
An explosive and dynamic digital artwork that brings to life the key metrics and visualizations from a COVID-19 vaccination data analysis. The central focus should be three larger-than-life representations of KPI gauges or indicators, each one reflecting one of the core metrics explored: partially vaccinated population, fully vaccinated population, and the share of unvaccinated individuals.
Render these KPI elements in brilliant neon colors that seem to crackle with electric energy against a dark background. Sweeping arc motifs and animated particles could surround or emanate from the gauges, representing the data flows and calculations driving these metrics.
Across the canvas, incorporate abstracted country/regional map outlines or continental silhouettes, but rather than showing geographic borders, have these territories defined by intricate data-inspired textures and patterns. Some areas could be highly illuminated with striking gradients and contours, suggesting the countries ranked highest for vaccination rates based on your visualizations.
For areas with lower vaccination coverage, the textures and patterns could be faint, obscured, or fragmented as if the data is incomplete or obfuscated. The contrasting levels of illumination and complexity in these geographic abstractions should give an overall sense of the disparities in vaccination equity across different regions of the world.
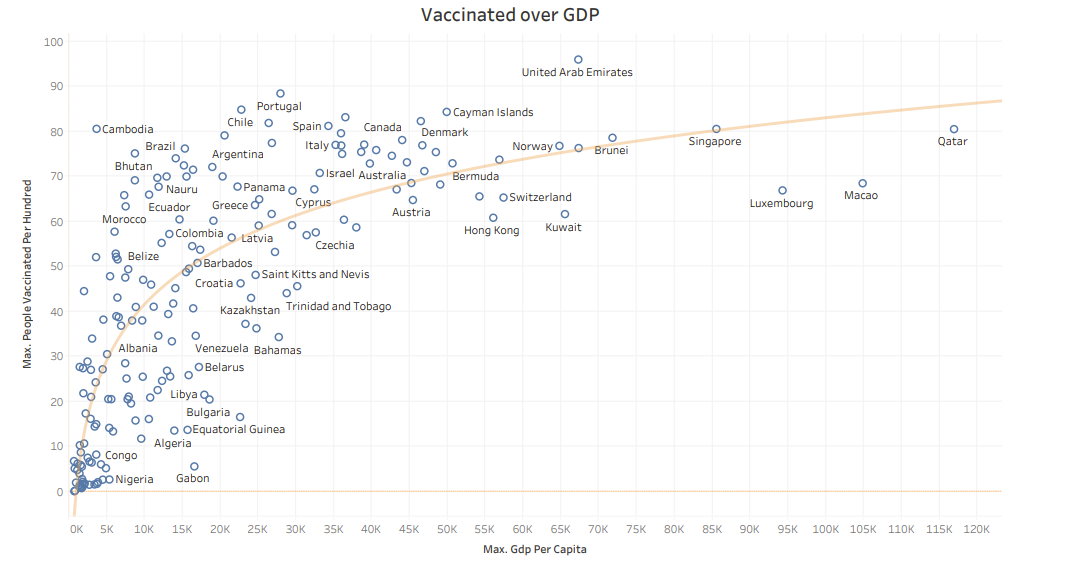
Additionally, integrate a pair of towering spiral pillars, one constructed from intricate lattices of bright turquoise and green data arcs, and the other from deep red and amber strands that seem to flicker and pulse. Between these pillars, a scattering of globular nodes in various sizes could represent your analysis of the correlation between vaccination rates and GDP.
The overall piece should be a captivating exploration of your COVID-19 data narrative through bold colors, dynamic energy, and meta-representations of the key metrics and visualizations you created. While the artwork should be visually striking, the data story should remain the core focus through thoughtful use of abstract metaphors and illumination representing your findings.