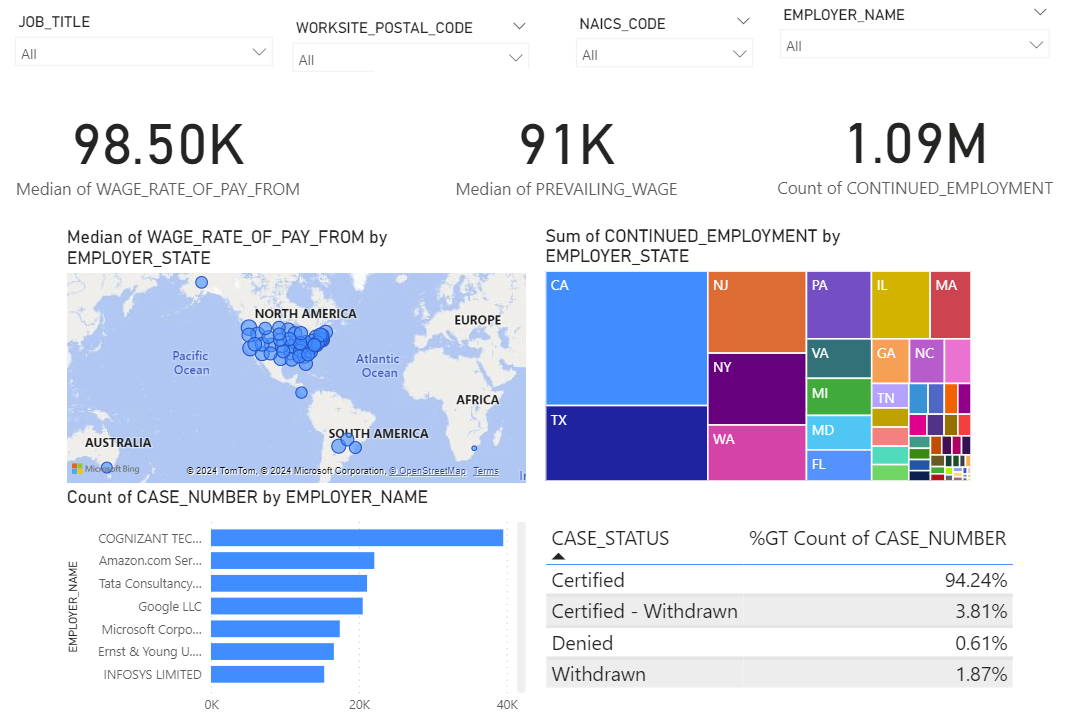
Through an immersive and visually captivating Power BI dashboard, I've meticulously crafted a comprehensive analysis of the H-1B visa program, shedding light on the intricate dynamics that shape this vital component of the American workforce.
At the heart of this interactive experience lies a compelling array of visualizations that seamlessly blend aesthetics with insightful data narratives. Delve into the nuances of wage distributions, contrasting the median wage paid to H-1B visa holders against the prevailing wage benchmarks across industries. Witness the sheer scale of employment through a compelling count metric, underscoring the program's profound impact.
Venture further, and you'll uncover a global map that illuminates the diverse origins of H-1B visa recipients, painting a vivid picture of the program's international reach. Closer to home, an intuitive heatmap sorted by state unveils the geographic concentration of these skilled professionals, enabling you to discern regional patterns with ease.
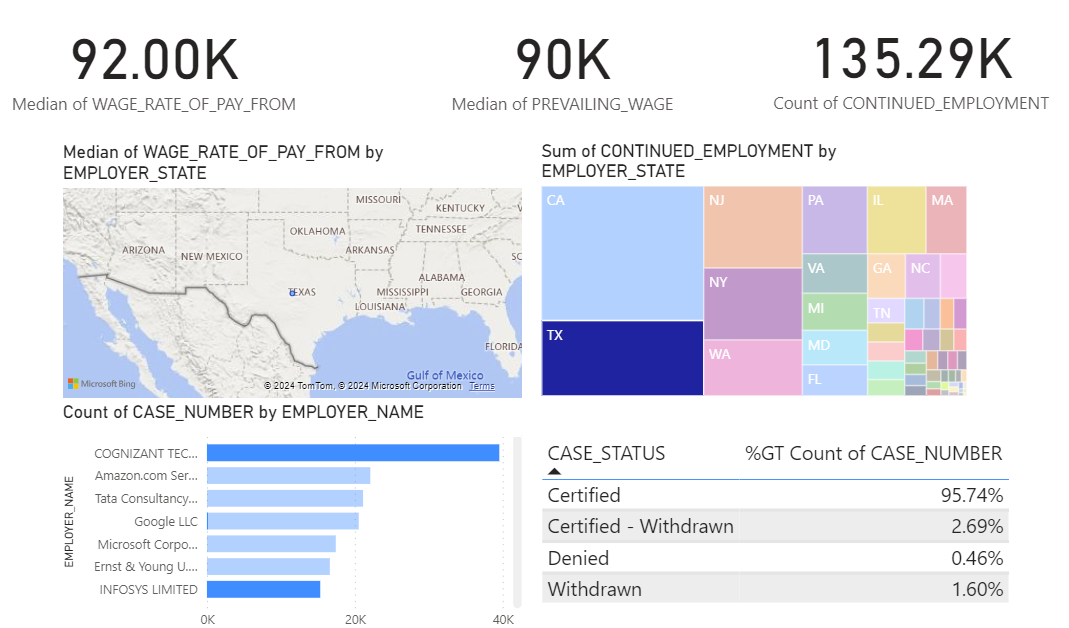
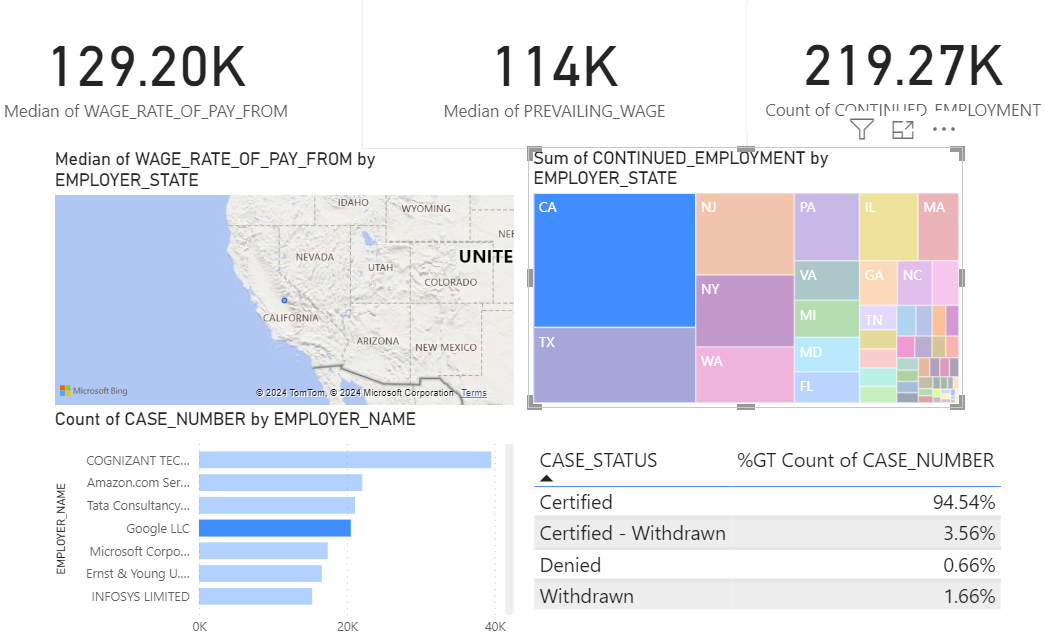
But the revelations don't stop there. A meticulously crafted bar chart spotlights the top seven companies that sponsor H-1B visas, offering invaluable insights into the industries and sectors that drive the program's demand. And for those seeking a granular understanding, a comprehensive case status list, complete with insightful percentages, provides a holistic view of the application landscape.
Through this immersive dashboard, I've woven together a tapestry of data-driven narratives that not only inform but also captivate. Prepare to embark on a journey that unveils the intricate dynamics of the H-1B visa program, empowering you with a profound understanding of this vital component of the American workforce.